
Data Collection

Where We’ve Cleaned Up
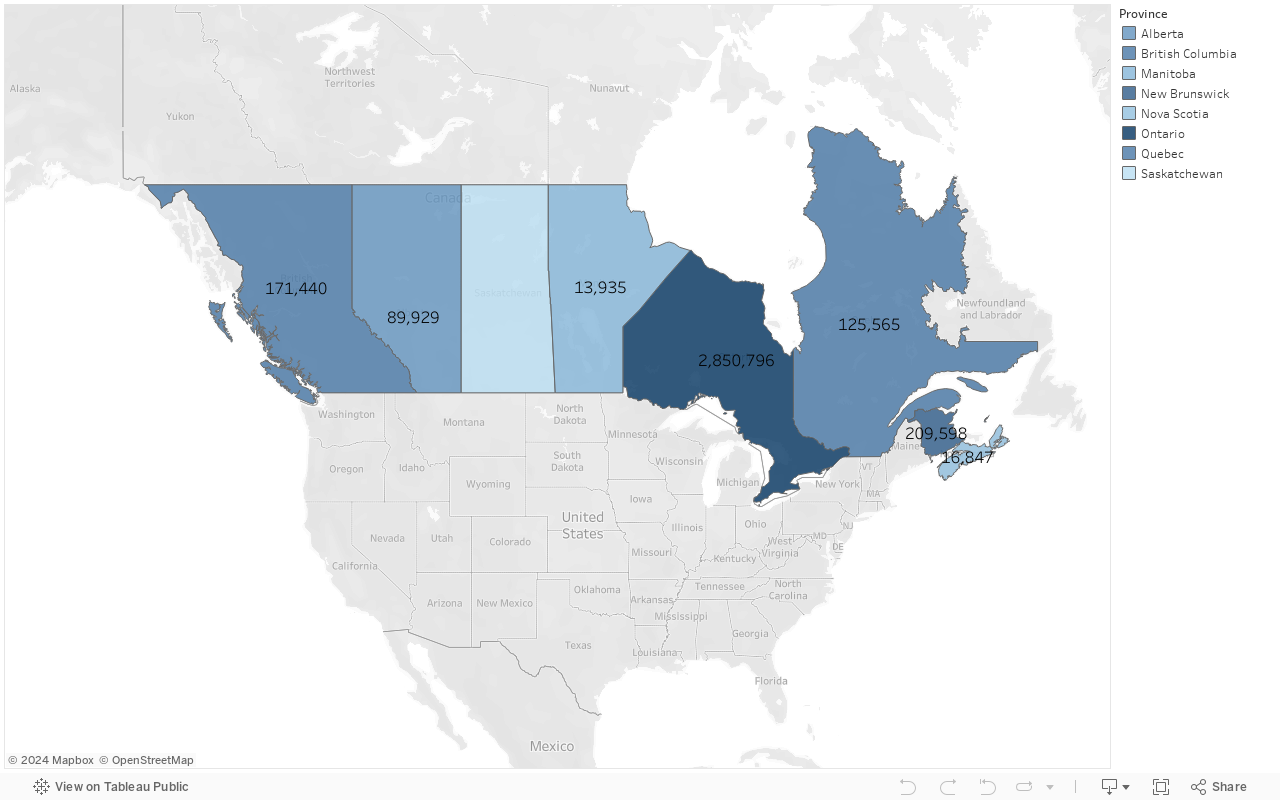
The majority of our cleanups are based around Lake Ontario, but for some events, including our annual Butt Blitz, we have volunteers participate from all over! Click the interactive map to see where we’ve cleaned up.
Litter Breakdown
Interact with the flow chart below to learn more an about our litter collection data.
The Top 10 “Problem Items”
These are the most common litter items collected by frequency
Cigarette Butts: 4,494,939
Plastic Pieces: 248,310
Foam Pieces: 170,909
Food Wrappers: 126,151
Paper Pieces: 93,909
Plastic Bottle Caps: 54,541
Plastic Straws: 20,039
Plastic Bags: 20,311
Plastic Bottles: 17,551
Hygiene Items: 19,953
*data accurate as of February 9, 2024
Total Litter Picked Up
Why Do We Collect Data?
Collecting litter data allows us to better understand which types of litter are the most prevalent in our ecosystems. When you think of plastic pollution, you probably think of the Ocean. Many people don’t realize that plastic pollution is also a big problem in the Great Lakes. The data we collect helps to illustrate the gravity of the issue and provides communities with the knowledge to take action.
How We Collect Data
Our data is collected using a community science model, in which our volunteers participate in the data collection process. Volunteers receive training in the handing, sorting, and recording of litter data. We believe this method empowers volunteers, builds collective knowledge, and inspires meaningful engagement with the environment.
2018 Data Enhancement Project
We are honoured to have received funding from the Ontario Trillium Foundation to support our data enhancement project. They generously provided $31,400 to improve our data collection, analysis and presentation methods. Data is a major part of what we do, because we collect data on every piece of litter we pick up. Needless to say, after picking up over 3.2 million pieces of litter we have a lot of data to work with.
Previously, we had been keeping this data in a basic spreadsheet, but it was becoming hard to read and wasn’t being used to its full potential. As a result of this data enhancement project, we have streamlined our data and now have the ability to present it in new ways.